
A Plant-Level Method for Turning Reagent Efficiency Into Margin
A rising gold price hides a lot of operational drift. The reagent line is one of the few costs a plant can measure and move.
AngloGold Ashanti's Q3 2026 update gives a clear read on gold mining economics at current prices: average realised price US$4,239/oz against US$3,490/oz a year earlier, and all-in sustaining cost US$2,170/oz against US$1,720/oz. Prices rose faster than costs, but royalties, fuel and capital intensity all climbed. For a plant operator, the useful response is not a macro view — it is a method that converts reagent efficiency into a cost-per-ounce figure that can be compared with the AISC line.
ประเด็นที่สำคัญ
- Realised price rose 21% year on year to US$4,239/oz from US$3,490/oz.
- AISC rose too: US$2,170/oz against US$1,720/oz, driven by price-linked royalties, fuel and capital intensity.
- Production fell to 696,000 oz from 768,000 oz, so cost per ounce absorbed fixed cost over fewer ounces.
- Free cash flow fell to US$722 million from US$920 million as capital expenditure climbed to US$563 million from US$388 million.
- Reagent efficiency is measurable. Side reactions, over-dosing and คาร์บอน fines are three loss channels that can be quantified in kg/t and converted to cost per ounce.
- Do not let price mask drift. A high gold price makes a rising consumption trend easy to ignore until the cycle turns.
| เมตริก | Q3 2026 | Q3 2025 |
|---|---|---|
| ราคาทองคำที่ขายจริง | 4,239 เหรียญสหรัฐ/ออนซ์ | 3,490 เหรียญสหรัฐ/ออนซ์ |
| เอไอเอสซี | 2,170 เหรียญสหรัฐ/ออนซ์ | 1,720 เหรียญสหรัฐ/ออนซ์ |
| EBITDA | 1,568 ล้านเหรียญสหรัฐ | 1,400 ล้านเหรียญสหรัฐ |
| การผลิต | ออนซ์ 696,000 | ออนซ์ 768,000 |
| การเงินสภาพคล่อง | 722 ล้านเหรียญสหรัฐ | 920 ล้านเหรียญสหรัฐ |
| รายจ่ายลงทุน | 563 ล้านเหรียญสหรัฐ | 388 ล้านเหรียญสหรัฐ |
Price-linked royalties added to unit costs over the period. Source: company Q3 2026 update, 5 November 2026. All figures above are disclosed company numbers; no plant cost figures have been estimated by the publisher.
1. Why a rising price is a poor excuse for drifting consumption
When realised price rises 21% year on year, a plant can absorb a meaningful increase in unit cost and still report a healthy margin. That is precisely the condition in which operational discipline slips: over-dosing becomes invisible, carbon make-up is written off as routine, and a rising reagent spend per tonne is attributed to ore rather than measured.
The Q3 2026 numbers show why that is risky. AISC rose US$450/oz while production fell from 768,000 oz to 696,000 oz, so fixed cost was spread over fewer ounces. Free cash flow fell even as EBITDA rose, because capital expenditure climbed from US$388 million to US$563 million. Price-linked royalties, fuel and capital intensity are largely outside a plant metallurgist's control; reagent efficiency is not.
2. Three reagent loss channels worth quantifying
2.1 Side reactions and impurity demand
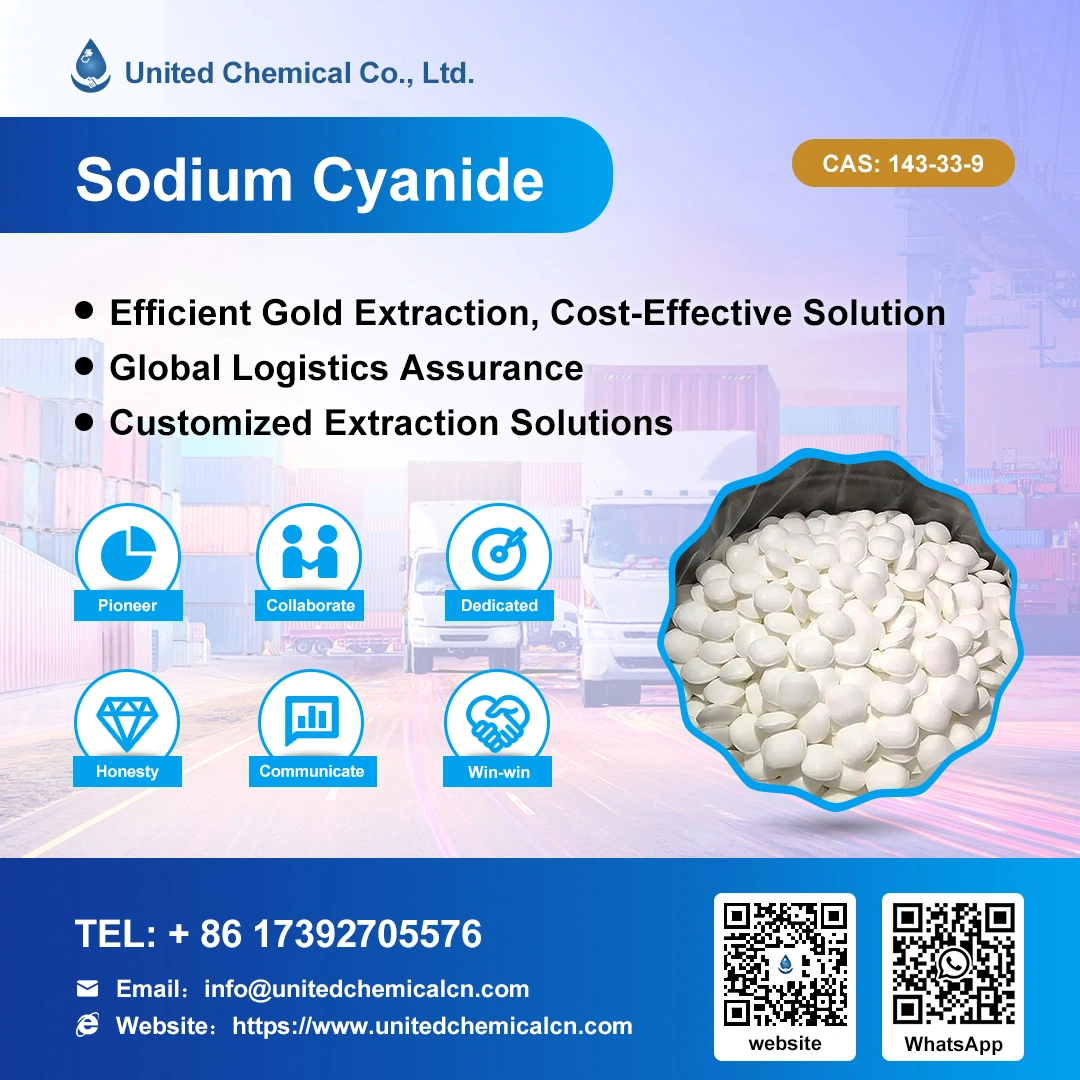
Excess NaOH and Na₂CO₃, copper and arsenic minerals and high insolubles all consume reagent without dissolving gold. A high-purity NaCN briquette with low insolubles narrows that loss, and the batch COA is the reference for measuring it.
2.2 Over-dosing after the dissolution plateau
A flat continuous feed wastes reagent in the final hours of a leach, when the dissolution curve has flattened. A front-loaded, tapered dosing profile built from a bottle roll curve removes that spend without changing recovery.
2.3 Carbon fines carrying loaded gold
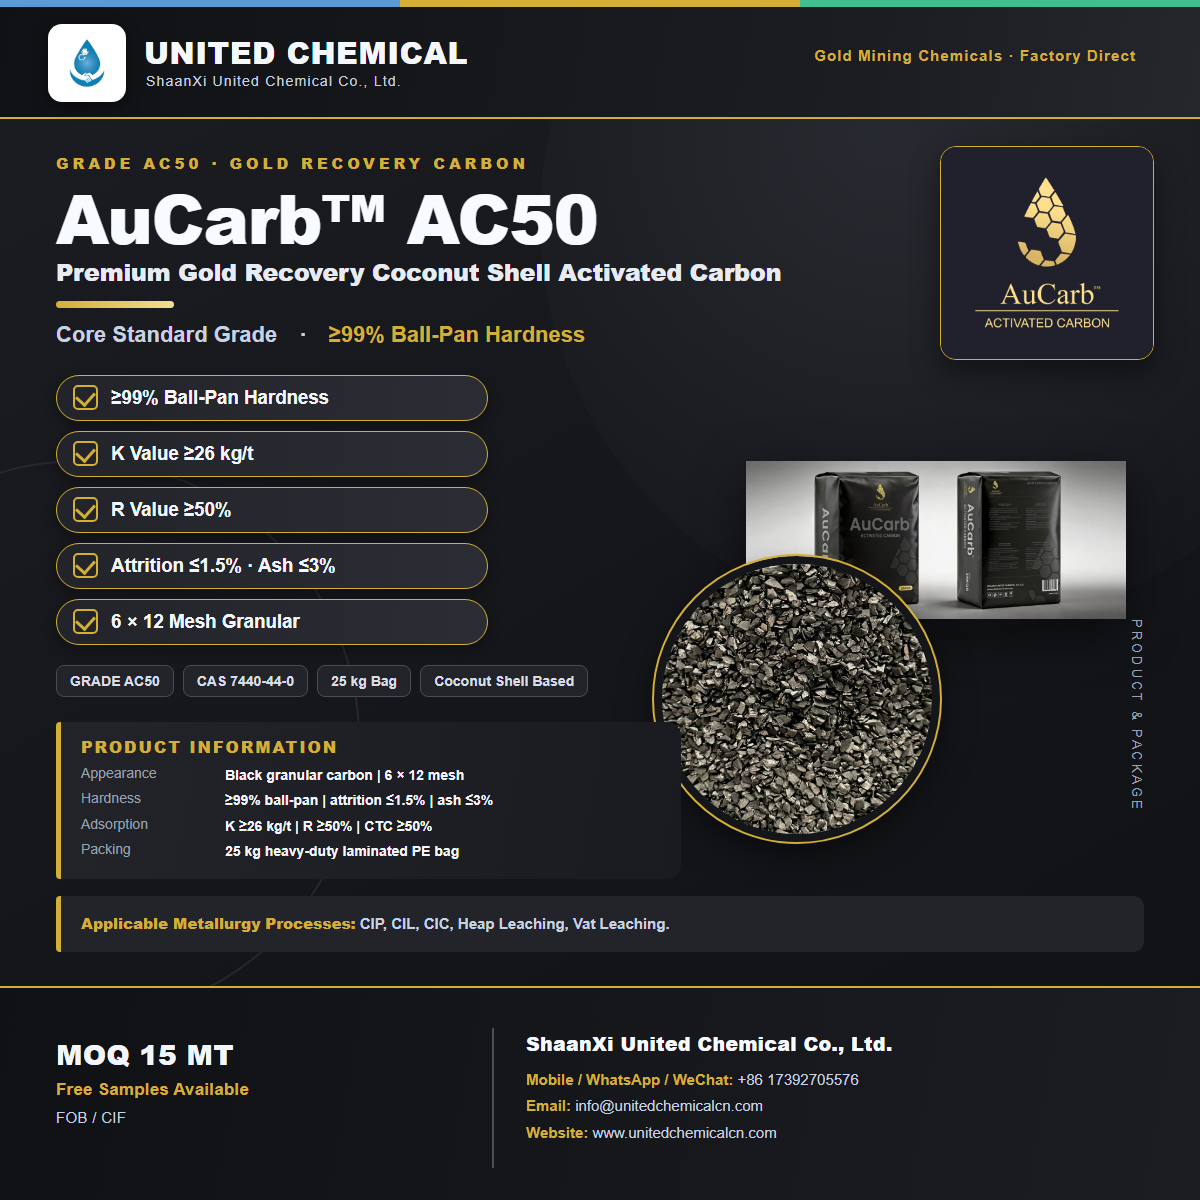
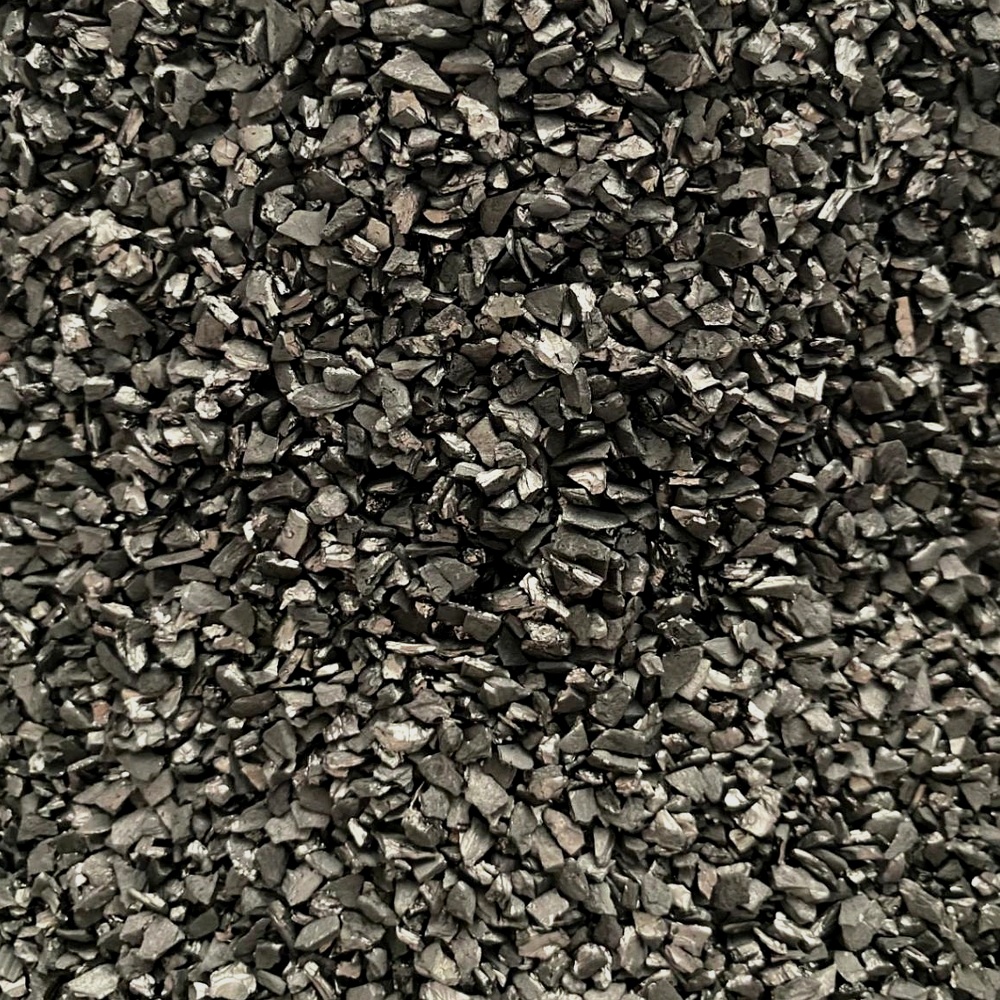
Fines generated above the ≤1.5% attrition design limit leave the circuit already loaded. The loss shows up as a gap between dissolved and recovered gold, not as a reagent invoice — which is why it is usually underestimated.
3. Tutorial: six steps from reagent efficiency to margin per ounce
- Establish a cost-per-tonne baseline. From plant logs, compute reagent spend per tonne of ore treated for a defined period, broken down by leaching reagent and carbon make-up.
- Decompose the three loss channels. Estimate the kg/t attributable to side reactions, to over-dosing after plateau, and to carbon fines carrying gold. Use measured titration and carbon inventory data, not assumptions.
- Compute the recoverable saving per tonne. Apply your own delivered reagent cost to the avoidable kg/t. Keep this separate from the gold value of recovered fines.
- Convert to cost per ounce. Divide the saving per tonne by recovered grade times metallurgical recovery to express it in currency per ounce, on the same basis as AISC.
- Compare with the AISC movement. Set the result against the US$450/oz year-on-year AISC increase. This tells you what share of cost pressure is addressable inside the circuit.
- Lock the gains with documentation. Batch COA, TDS and MSDS per lot, a fixed dosing profile, a defined free-ไซยาไนด์ or residual-reagent titration routine, and a carbon attrition target at ≤1.5%.
The method uses your own measured inputs. Published market figures set the context; they are not substitutes for plant data.
4. ตารางการแก้ไขปัญหา
| อาการ | สาเหตุน่าจะ | ตรวจสอบครั้งแรก |
|---|---|---|
| Reagent spend per tonne rising | Side reactions or flat dosing profile | COA impurity figures, titration log, dissolution curve |
| High residual reagent in tails | Dosing continues after plateau | โปรไฟล์การเติม ความถี่ในการไทเทรต |
| Dissolved versus recovered gold gap | Loaded carbon fines leaving circuit | Attrition against ≤1.5%, tails assay, screen aperture |
| Cost per ounce worse with fewer ounces | Fixed cost over lower production | Throughput, grade, recovery |
| ไม่สามารถระบุสาเหตุของความคลาดเคลื่อนได้ | Lot not linked to plant log | COA filing, sampling routine |
5. Where the three products act on the cost line
| Loss channel | สินค้า | Control |
|---|---|---|
| Impurity-driven side reactions | AuCyan™ โซเดียมไซยาไนด์ NaCN (≥98.3%) | Low NaOH / Na₂CO₃ / insolubles; batch COA |
| Loaded-gold loss to fines | AuCarb™ Gold Recovery ถ่านกัมมันต์จากกะลามะพร้าว (ความแข็ง ≥99%) | Attrition ≤1.5%, 6×12 mesh, platelet ≤5.0% |
| Permit-driven schedule cost | สารชะล้างทองคำ AuLeach™ (GDA) – ปลอดภัยไร้สารอันตราย | General-cargo route, pH 10.5–12 validation |
United Chemical supplies all three factory-direct under FOB or CIF terms with batch COA, TDS and MSDS, serving mining operations in more than 77 countries at 15 / 18 / 28 MT minimum order quantities per 1×20' FCL.
6. คำถามที่พบบ่อย
Q1. What was the Q3 2026 realised gold price?
US$4,239/oz, up from US$3,490/oz a year earlier — a 21% increase.
Q2. What was the Q3 2026 AISC?
US$2,170/oz against US$1,720/oz in Q3 2025.
Q3. Did production rise with the price?
No. Production was 696,000 oz against 768,000 oz a year earlier, so fixed cost was spread over fewer ounces.
Q4. Why did free cash flow fall while EBITDA rose?
Capital expenditure climbed to US$563 million from US$388 million, taking free cash flow to US$722 million from US$920 million.
Q5. Which cost drivers are outside plant control?
Price-linked royalties, fuel and capital intensity. Reagent efficiency is one of the few variables a plant team can measure and move.
Q6. What are the three reagent loss channels?
Impurity-driven side reactions, over-dosing after the dissolution plateau, and carbon fines carrying loaded gold.
Q7. How do you express a reagent saving on the same basis as AISC?
Compute the avoiding cost per tonne of ore, then divide by recovered grade times metallurgical recovery to get a currency-per-ounce figure.
Q8. Which product controls impurity-driven side reactions?
AuCyan™ Sodium Cyanide NaCN (≥98.3%), with controlled NaOH, Na₂CO₃ and ultra-low insolubles verified against the batch COA.
Q9. Which carbon parameter limits gold loss to fines?
Attrition ≤1.5% on AC50, together with ≥99% hardness, a 6×12 mesh cut and platelet ≤5.0%.
Q10. Incoterms ใดบ้างที่ใช้บังคับ?
เงื่อนไขเป็นไปตาม FOB หรือ CIF
Q11. Can published market figures replace plant data in the calculation?
No. Grade, recovery, kg/t consumption and delivered reagent cost must come from plant logs; market figures only set the context.
Q12. สามารถตรวจสอบรายละเอียดข้อกำหนดได้ที่ไหน?
ในหน้าข้อมูลทางเทคนิคของ AuCyan™, AuCarb™ และ AuLeach™ ที่ลิงก์อยู่ด้านล่าง จะมีใบรับรองการวิเคราะห์ (COA), เอกสารข้อมูลทางเทคนิค (TDS) และเอกสารข้อมูลความปลอดภัยของวัสดุ (MSDS) สำหรับแต่ละล็อต
7. แหล่งที่มาและลิงก์ภายใน
AuCyan™ · คู่มือ AuCarb™ · AC50 · AC55 · AC60 · BC1100 · AuLeach™ GDA · สามเหลี่ยมทองคำ · ภาพรวมผลิตภัณฑ์สามชนิด · คำถามที่พบบ่อยเกี่ยวกับสารเคมี · ข่าวสารในอุตสาหกรรม · ติดต่อเรา
Source note: company figures are drawn from the Q3 2026 update dated 5 November 2026. Reagent specifications are United Chemical product data. The calculation is a method using plant-supplied inputs.
ติดต่อเรา · WhatsApp +86 173 9270 5576 · info@unitedchemicalcn.com
- เนื้อหาแบบสุ่ม
- เนื้อหาร้อนแรง
- เนื้อหารีวิวสุดฮอต
- ผู้เชี่ยวชาญด้านความสัมพันธ์กับลูกค้าและซัพพลายเออร์ที่ยืดหยุ่น (สถานที่: อินเดีย)
- แม่เหล็กไฟฟ้า (ป้องกันกระแสไฟรั่ว)
- อะคริลาไมด์
- โซเดียมกลูโคเนตสำหรับการบำบัดน้ำ
- United ChemicalTuXingSun Mining และเหมืองทองคำ Henan Lingbao ร่วมกันจัดตั้งเหมืองที่ปราศจากไซยาไนด์
- การนำทางการเปลี่ยนแปลง: ทิศทางในอนาคตของอุตสาหกรรมเคมี
- สารเคมีชนิดใดกัดกร่อนมากที่สุด?
- 1โซเดียมไซยาไนด์ลดราคา (CAS: 143-33-9) สำหรับการทำเหมือง - คุณภาพสูงและราคาที่แข่งขันได้
- 2โซเดียมไซยาไนด์ 98.3% CAS 143-33-9 NaCN สารแต่งสีทองคำ จำเป็นสำหรับอุตสาหกรรมเหมืองแร่และเคมี
- 3กฎระเบียบใหม่ของจีนเกี่ยวกับการส่งออกโซเดียมไซยาไนด์และแนวทางสำหรับผู้ซื้อต่างประเทศ
- 4ใบรับรองผู้ใช้ปลายทางโซเดียมไซยาไนด์ (CAS: 143-33-9) (เวอร์ชันภาษาจีนและภาษาอังกฤษ)
- 5รหัสการจัดการไซยาไนด์ระหว่างประเทศ (โซเดียมไซยาไนด์) - มาตรฐานการยอมรับเหมืองทองคำ
- 6โรงงานในประเทศจีนกรดซัลฟิวริก 98%
- 7กรดออกซาลิกแบบไม่มีน้ำ 99.6% เกรดอุตสาหกรรม
- 1โซเดียมไซยาไนด์ 98.3% CAS 143-33-9 NaCN สารแต่งสีทองคำ จำเป็นสำหรับอุตสาหกรรมเหมืองแร่และเคมี
- 2ความบริสุทธิ์สูง · ประสิทธิภาพที่เสถียร · การกู้คืนที่สูงขึ้น — โซเดียมไซยาไนด์สำหรับการสกัดทองคำสมัยใหม่
- 3United Chemicalทีมวิจัยของเราแสดงให้เห็นถึงอำนาจผ่านข้อมูลเชิงลึกที่ขับเคลื่อนด้วยข้อมูล
- 4AuCyan™ โซเดียมไซยาไนด์ประสิทธิภาพสูง | ความบริสุทธิ์ 98.3% สำหรับการทำเหมืองทองคำทั่วโลก
- 5จุดระเบิดอิเล็กทรอนิกส์แบบดิจิตอล (เวลาหน่วง 0~ 16000ms)
- 6จุดระเบิดแบบท่อช็อกที่มีความแข็งแรงสูงและความแม่นยำสูง
- 7อุตสาหกรรมเครื่องจุดระเบิดไฟฟ้า



ปรึกษาข้อความออนไลน์
เพิ่มความเห็น: